In the realm of Artificial Intelligence (AI) some amazing things are being done by some amazing people that are leading to some amazing results. Hopefully this pacifies the shallow learning experts. Now for the deep(er) learning aspects of the current push of AI everywhere and for all. For the older engineers[1], most of the models being deployed (with updates) have been there for many years so what gives? Well for one we know that great strides in readily available computing power have been a great catalyst for the more pervasive push of AI. Another has been the ever-increasing money[2] supply via the Venture community for the race to automate all things human and their ability to sell assets between themselves or to the next tier private or public community. All leading to making engineering cool again with more jobs available than degrees being printed. Therein, establishing the current cycle by pointing the research engines at the opportunities at hand. Can you imagine if the same was done for disease (could we solve a lot more than Covid-19 vaccines)?
Okay but what does this have to do with Y2K? Well for the history students, every boardroom, chat room, money room and classroom were pushing for solutions to the elusive double zero so the world would not come to a standstill. Since the world needs the engines running, it led to amazing billable hours for participants, spawning many startups, mixed solutions from developers and money being thrown at buzzwords. Pressure from time and money deployment compressed the processes for separating the grain from chaff, which led to some not so pretty conclusions when the meals were finally consumed. History does repeat itself albeit maybe with some twists, tweaks and turns. Similar compressed, expedited processes were seen during other such hyped times including the dot com bubble. And, as we were writing this the equity markets were unraveling and the crypto bandwagon is near reckoning so, it’s Groundhog Day. We were too distracted in publishing our Insights, and lo and behold the Google debacle, where on February 9th, 2023 it lost $100 billion dollars as the market punished it for its tardy Bard presentation. But was it tardy or is there an “AI catch up or lose” issue being exemplified? We find it interesting that a few VCs are pointing to “practicing/checking the pitch before the presentation”. Cannot see the forest for the trees?! The point remains that the pace with which all things AI were/are being sold to consumers (users, funders, advisors, et all) seems to rekindle some memories for those of us that were at the table during the Y2K frenzy. Maybe a little bit of overuse, abuse and misuse of AI and its applications? By no means are we saying that AI is not here to stay, it’s just that the level of intensity varies across use cases, areas, etc. As we illustrate below, balance the expectations for the use case depending on the skill/experience level and potential task complexity.

We narrow this discussion to the financial markets. Given the current AI business environment, one could consider using NLP techniques to read and file documents as somewhat of a Boxed case. Whereas, implementing Natural Language Processing (NLP) techniques to read real time data for advantageous financial trading so far remains an Advanced case. Another way to look at this is applying Boxed cases in the non-stationary / research quadrant may be punitive and applying Advanced cases in the stationary / implement environment may be overkill (and potentially less interesting for some). So, as with Y2K or the dot com or “then some”, participants will burn money on AI as it’s the new big idea whose time has come. Our suggestion is that if you have a seat on the table, it may be wise to look at the ingredients, chefs and the dishes more closely. Where, the more complicated dishes may need more than a naïve attempt from a cookbook and an independent mechanism for judgment.
We begin our Insights section by sharing our thoughts, analyses and findings in building our platform. The platform is geared towards the Financial Markets, but the lessons are fungible. We highlight examples of deployment optionality evaluated for an advanced case. Consider Mutual Fund manager selection[1], where deployment of AI is in a non-stationary market with the need to assess many manifolds concurrently. We look at implementation optionality within AI’s three pillars,
- Data
- Model
- Visuals
We further set the judge as a model stability framework that allows us to evaluate the tracking error among other elements. Since this is done over time on out of sample data, the judge is an independent unbiased framework for evaluating the results (as we will see there is optionality there too).
Additionally, we stay away from the arguments around why these three or which pillar is more important and try to continue highlighting that the use cases, judges, participants, et al are not the same. This is because we believe that beyond considering all as vital pillars, each user case could have a very different path to “its” optimal solution. Finding that path or the tuning is possibly the key. We had some fun below in illustrating some possible ways of connecting the dots.
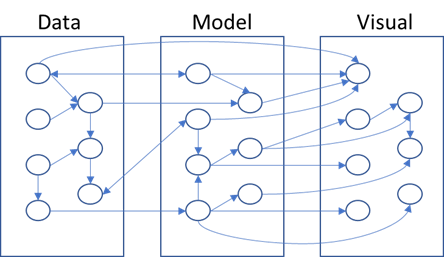
Not surprisingly, there are numerous ways to connect the dots. For the Boxed cases, they may have been somewhat established (for the use case), but until the Advanced cases become Boxed the paths have to be tuned or it’s open for arbitrage. Overall, for maximum effectiveness, it may be best to try not to compress the processes for separating the grain from the chaff.
Mutual Fund Manager Selection
In illustrating some alternative paths or ways of connecting the dots for mutual fund manager selection we look at some optionality within each of the three pillars.
Data, the ingredients for the dish, remains a critical pillar, simply put as far as we know models are not clairvoyants (yet). In general, robust models are able to deal with more data better than with less data. At the same time, feeding similar data may lead to overfitting, auto-correlation and other not so pleasant issues. For our illustration of Mutual Fund manager selection, we stay away from whether a mutual fund is correctly characterized for managing an asset class based on the holdings and take the reported industry classifications as a given (generally, the same analysis would be applicable if the mutual fund groupings were based on price, holdings, alternative data or other such clusters).
Given the traditional industry classifications, for (each of) the Asset Classes, we can build a time series of performance measures derived from Mutual Fund prices. There are over a hundred[1] such performance measures and there is an assessment choice of time horizons (e.g., monthly, quarterly, annual, 3-years, 5-years, etc.) and roll/look back windows (e.g., daily, monthly, quarterly, etc.). Since dealing with so many measures can be problematic (for control, assessment and explainability purposes) we proposed[2] the Explainability Index (EI) and Risk of Target (RoT) as a unifying framework for all the measures. Similarly, there are alternate paths to evaluating the Mutual Fund data, including historical data (as is data or reduced data (e.g., dimensionality reduction to transform and reduce the number of Performance Measure features (and/or other datasets) so a single time series can represent a set (without losing any information))), predicted data (as is or reduced), stressed data, synthetic data, etc. The performance measure dataset can further be supplemented with Alternative, Holding, Sentiment, Macro and other datasets. The choice of the dataset and the feature extraction itself can be manual, based on basic analysis or incorporate some forms of machine learning and/or auto-fit based tuning. Overall, the motivation remains to use the datasets as manifolds for generating signals on the attractiveness or assessment of the Mutual Funds.
Models, the utensils for the dish, remain a critical pillar as we need to be able to pick the right one and have a mechanism to know when it’s the wrong one. A model is nothing other than a means to make the selection of the Mutual Fund (back testing and simulation models notwithstanding). The selection itself can be looked at as a form of a ranking problem, where the choice is being driven by some objective function. The tool for executing the objective function is the model, where it can be simplistic and be based on a single measure (performance measure, holding, etc.), a fixed equation that incorporates many measures, Regression based (Linear, Lasso, Ridge, Elastic Net, etc.), Machine Learning based (Random Forest, XGBoost, etc.), Deep Learning based (Artificial Neural Networks) or Online learning models that choose from all models depending on the circumstances. Therein, the circumstances themselves need to be modeled and could include Objective Function(s), Regimes, Events, Situations, Sentiment, etc. Another set of models include the back testing models, where a model stability framework needs to be set up to continually assess if the chosen model is behaving (as in the ranking/selection is valid) and the triggers to note if/when the model is misbehaving and what to do (hopefully as a leading indicator). The final set of models are the simulation models that can give color on the behavior of the ranking/selection results under different scenarios. It should be noted that as we go beyond Mutual Fund Manager selection other sets of models and extensions come into play such as for Risk Management, Asset Planning, etc.
Visuals, the appeal/taste of the dish, remains a critical pillar as we need to be able to demonstrate “the why” and “so what” in a transparent and simple manner. Visuals force the financial engineers to bring a sense of realism into their analyses (simple or complex). If audience engagement is important (as we believe it is) then as they say a simple picture should speak a thousand words (or let the duck majestically glide, while its feet paddle feverishly under water). We will not delve into the myriad of visual/presentation choices, simply put, if the visuals are not meaningful, intuitive, or easily explainable then however complex the processes the results may not be “useful” and will possibly be put in a drawer somewhere.
SETUP
With this piece, we set the groundwork for introducing machine and deep learning techniques for mutual fund manager selection (and then for Asset Allocation, Portfolio Construction, and so on). Across the insights writeups, we will go through the journey so practitioners can better appreciate where in the journey their beliefs and/or firms reside, with a possible nudge to explore the evolutionary stages.
Insights 2.00. Mutual Fund Manager Selection – Setting up the framework
Extensions can be drawn to other types of managers, assets, and markets.
Insights 2.10. Mutual Fund Manager Selection – Basic Historic Analysis: Are you always wrong?
We holistically look at the US mutual fund manager landscape from a historical fund price perspective and assess the ability of widely used performance measures for manager selection. This is done both at the market and individual fund level. Then as simple extensions we evaluate regressions for generally fixed weighting schemes of performance measures over fixed time periods and during discrete regimes. We look at simple back testing and predefined simulations. We will give Insights for every Asset Class.
Insights 2.20. Mutual Funds – Is there value in leveraging larger datasets?
We incorporate larger volumes of macro data, market data, performance measures, holding data, alternative data, etc. We introduce forms of feature engineering to generate signals for regimes, factors, indicators and measures using both raw and reduced datasets. We also introduce synthetic data generation to supplement sparse datasets.
Insights 2.30. Mutual Funds – Machine and Deep learning edge?
We incorporate evolving market conditions, performance measures, weights, events, predictions, etc. by leveraging Machine Learning techniques for real time and simulated multivariate analysis. Then we allow the system to do feature and event engineering by assessing various Deep Learning methods.
These are all underpinnings of our Platform, where it is built to support any/all permutation/combination of data/models/visuals.
Email: info@ask2.ai for questions.
NEXT
Insights 2.11. Mutual Fund Manager Selection – Basic Historic Analysis: Are you always wrong?
Focus: US AGG Mutual Fund Managers
[1] For the younger engineers, Y2K was the year 2000, when all computing was to come to an abrupt end due to the perceived poor programming of your elder generation. A lot of money was spent trying to fix the issue so, we will never know if there was an issue or billable hours.
[2] Remains to be seen how this will evolve as the waters recede in the oncoming lower tide.
[3] Similar framework applies to alternative asset manager selection or for underlying securities including stocks, bonds, ETFs, etc.
[4] Cogneau, P. and Hubner, G. (2009) The 101 Ways to Measure Portfolio Performance. Dessain, J. (2022) . Machine learning models predicting returns: Why most popular performance metrics are misleading and proposal for an efficient metric
[5] Hirsa, Ali and Ding, Rui and Malhotra, Satyan, Explainability Index (EI): Unifying Framework of Performance Measures and Risk of Target (RoT): Variability from Target EI (January 23, 2023). Available at SSRN: https://ssrn.com/abstract=4335455